Description
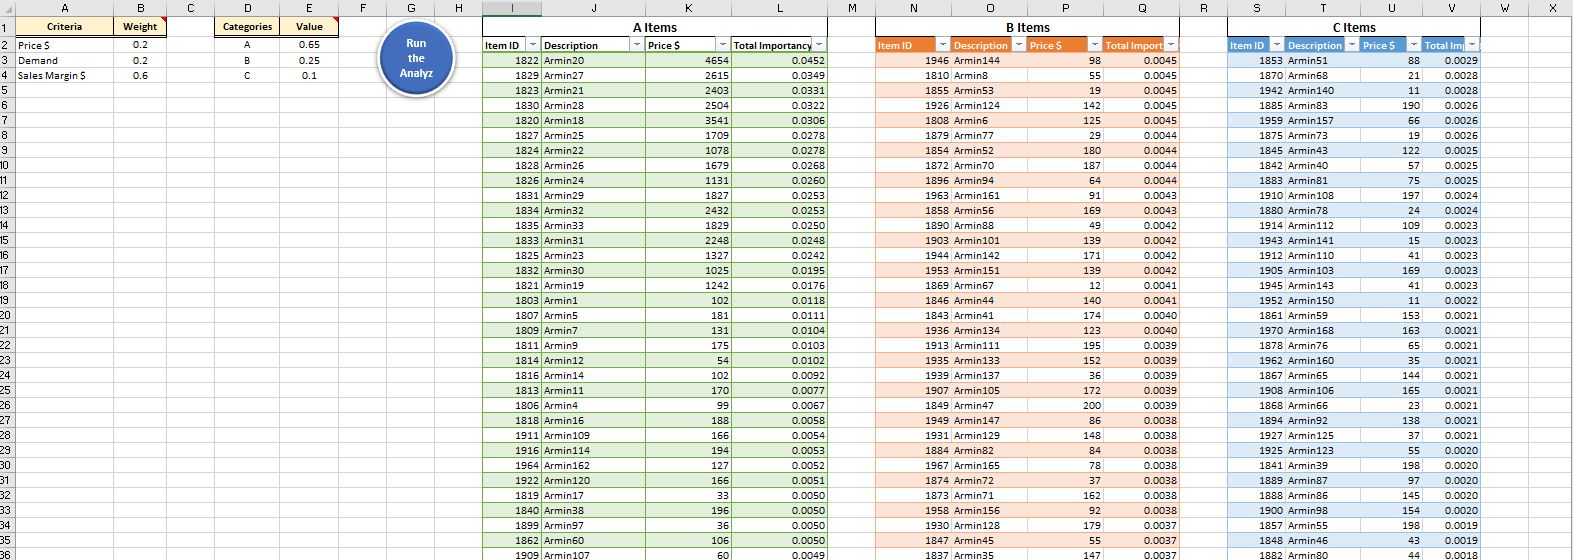
This software is developed in order to analyze huge number of items. ABC analyze is well known method for categorizing the inventory (or all other purposes) items into the A (very important items), B (average importance), C (not important items). This analyze is based on the Pareto principle, which saying that just 20 percent of items have 80 percent of value of population. So in inventory it has been said that, 20 percent of items have 70 percent of inventory value, 30 percent of items have 25 percent of inventory value and 50 percent of items have 5 percent of inventory value. So when we want to design an inventory system (and developing reorder point procedure), it is very important to categories our inventory items, and assign very rigid procedure for A category items, and loss approaches for B and C items.
For using this Excel file, you first need to specify the criteria of impotency of inventory (in most practice just one criteria assumed, which is multiplication of demand to profit. However, for more careful analyze, some can include more than one criteria and assume weight for each of them). After specifying criteria and assume weight for each of them, you need to enter the value of each category. As previously said, in most cases we assume 0.70 for category A, 0.25 for category B and 0.05 for category C (You can change that based on your inventory strategy and also based on how data distributed).
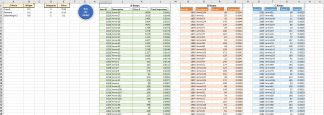
After specifying above data, you need to add raw data into the second sheet and just by running the analyze (pressing “Analyze” button) the analyze will be run and you can see categories data in first sheet as well as in the third sheet.
This Excel file should be used on Windows OS, by Microsoft Excel 2013, 2016 or above
Reviews
There are no reviews yet.